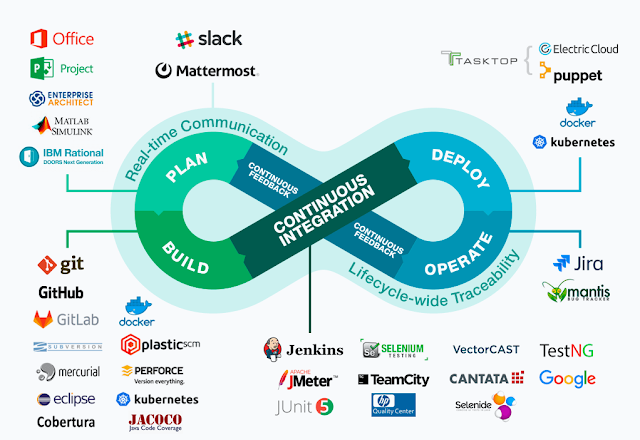
Grafana Monitoring Tool Configuration ( AWS EC2)
Step 1: Update the yum package repositories.
sudo yum update -y
Step:2. Add Grafana repository
sudo vi /etc/yum.repos.d/grafana.repo
add below lines into grafana.repo file:
[grafana]
name=grafana
baseurl=https://packages.grafana.com/oss/rpm
repo_gpgcheck=1
enabled=1
gpgcheck=1
gpgkey=https://packages.grafana.com/gpg.key
sslverify=1
sslcacert=/etc/pki/tls/certs/ca-bundle.crt
Step:3. Install grafana:
sudo yum install grafana -y
Step:4. Reload and start the service:
sudo systemctl daemon-reload
sudo systemctl start grafana-server
sudo systemctl status grafana-server
Step:5. Now open your browser and enter the server IP address and port 3000
http://ec2ip:3000
Default logins are:
Username: admin
Password: admin
Note:- we need to change the password immediately after authenticating.
Thanks & Regards,
Kanchan Soni
(A girl who saw the dream with an open eye to compete with self capability in the area of IT and its Next-Gen Technology, with the ability to complete the task with perfection.)
Email: kanchansoni.cse@gmail.com


Comments
Post a Comment