Prometheus Architecture
Prometheus Architecture

The easiest way to remember Prometheus architecture using Reliance Store:

Reliance Store
Architecture Study in detail:
It
is the core boundary of the Prometheus system, basically, it is divided into 3
parts.
- Retrieval
- Storage
- HTTP Server


Prometheus Server
Retrieval block retrieves or scrapes the data from target nodes which can be any system or application and then store that data in the storage Prometheus stores data locally into a custom time series database and its storage can be a hard disk drive or a solid-state drive and after that, the stored data is available to visualization tools like Grafana or Prometheus UI through HTTP. Anyone can query the data using PromQL over HTTP.
Prometheus Server Configuration?
2) Pull Method:
Now how does Prometheus retrieve
matrices from target nodes:
Prometheus most of the time uses the pull method while monitoring systems, this is a very important point to note that Prometheus by itself pulls the metrics from the target system, the target system does not push the matrices in Prometheus so if you have we have deployed Prometheus to monitor our systems or any application the, unlike other monitoring tools our application need not send metrics to Prometheus rather Prometheus itself pulls or scraps a metrics from the target.

Pull Method
This pulling feature of Prometheus over HTTP makes our applications offer more flexibility for developing changes.
Targets can be in form of
Jobs/Exporters, jobs as and our custom define jobs or we can use some exporters
to obtain matrices like Linux machines/window machines, etc.
Not only from the external
applications but to make Prometheus highly available it has also allowed us to
pull metrics from other Prometheus servers as well.
Ex. If there are 2 Prometheus
instances running then one Prometheus instance can pull or scarps the metrics
from others.
This was about how Prometheus pulls
the metrics from the target.
Metrix Type:
Counter – How many times has X happened?
Gauge – Current value of X now?
Histogram – How long or how big?

Sample Metrics
3) Exporter:Some servers are already exposing
Prometheus endpoints, so we don’t need extra work together metrics from them,
but many services don’t have native Prometheus endpoints so extra components
are required to do that and this component is an exporter.
So, the exporter is basically a
script or service that fetches metrics from your target and converts them in a
format Prometheus understands and exposes this converted data at its own metrics
endpoint where Prometheus can scrape them.
4) Push Gateway:
Overall
architecture believes pulling is a better option than pushing but there are
some special components.

Push gateway allows short-lived bad
jobs to push time series to an intermediary’s jobs but to use that job
Prometheus uses the pull approach only to fetch those pushed matrices from the
push gateway.
5) Service Discovery:
Once our application or our
exporters are ready and running to get scraped how Prometheus will know where
they are residing, I mean how it will know which entries it has to monitor and
how well it locates its targets this is what the service discovery is for.

To
make Prometheus aware of the targets we have 2 options:
Hard-core
targets
the targets which are not best practice as Prometheus does scrape the newly
generated nodes. Because Prometheus doesn’t have knowledge about these nodes
So,
another way for a dynamic environment can use service discovery which is
also the recommended approach.
As
in the real-time example, we have some inventory databases and replica
machines.
So, Prometheus has integration with some common services (like EC2, DNS, Kubernetes), whenever a change is made in the inventory like if any node is added since Prometheus has integration with inventory it will add that node automatically as a target and starts scraping it.
6) PromQL:
Now,
what happens after the matrices are scraped and stored in the database? These
matrices are available to the users. Using the Prometheus web user interface
you can request raw data with its very powerful query language PromQL.
Prometheus also can produce graphs and dashboards from scraped metrics. also, we can integrate Grafana, 3rd part API client to create our own nice dashboard

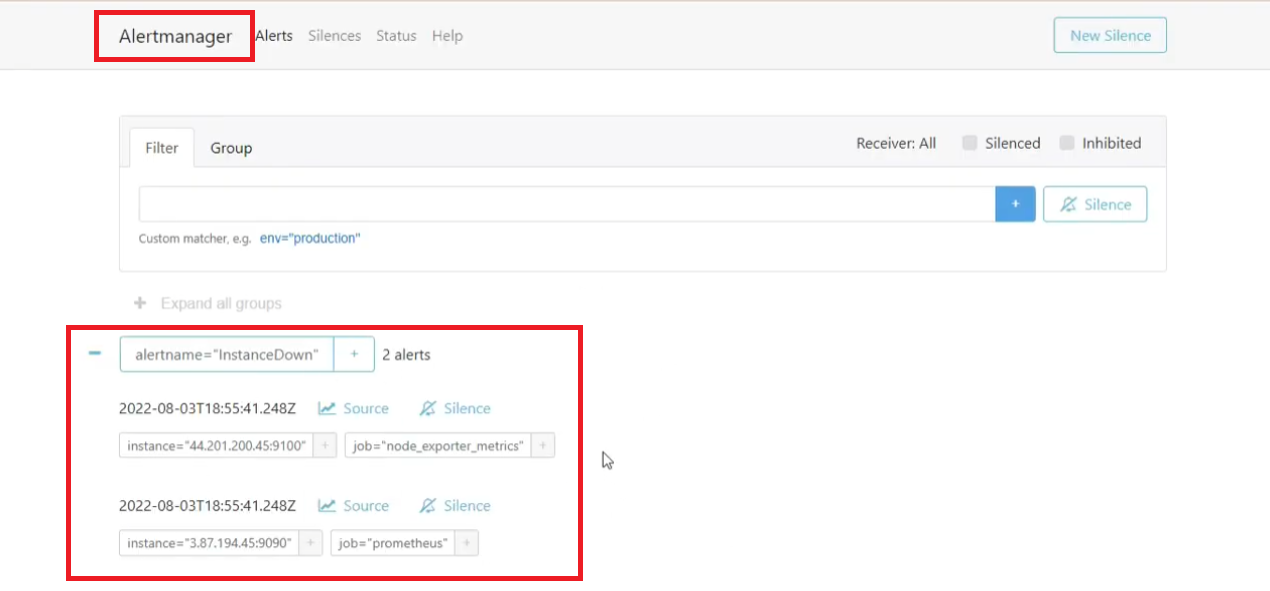
7) Alert Manager:
Alerts are posted by the Prometheus
servers into the alert manager. the alert manager after receiving the alerts
from the Prometheus servers aggregates those alerts into groups and sends the
notification by email, pager duty, slag, or other services to alert a human to
take an action on alerts

Monitoring own applications:
We can monitor our own application using client libraries:

Prometheus Dashboard:


---
Thanks & Regards,
Kanchan Soni
(A girl who saw the dream with an open eye to compete with self-capability in the area of IT and its Next-Gen Technology, with the ability to complete the task with perfection.)
Email: kanchansoni.cse@gmail.com

.
ReplyDeleteThanks for posting! I was in need of help on the topic of "Prometheus Architecture" for my assignment. I even hired a professional online class assistant to help me out.
ReplyDelete