Nagios Monitoring Tool & Its Features
Nagios Monitoring Tool and Features
Hey Folks,
Here is one of the best monitoring software in the market, which can monitor applications, networks, servers, memory, URL, HTTP, content, microprocessors, and many more.
Why Nagios called Nagios:
Nagios is a recursive acronym: "Nagios
Ain't Gonna Insist On Sainthood" – "sainthood" (पवित्रता) makes reference to the original name NetSaint (कोई संत नहीं), which changed in response to a legal challenge by owners of a
similar trademark. "Agios" (or "hagios") it transliterates the Greek word άγιος, which
means "saint".
What is Nagios?
Nagios is open-source software for continuous monitoring of systems, networks, and infrastructures (windows machine Linux machine, network devices, switches farewell, router, etc). It runs plugins on a server that is connected with a host or another server on our network or the Internet. In case of any failure, Nagios sends alerts about the issues so that the technical team can perform the recovery process immediately.
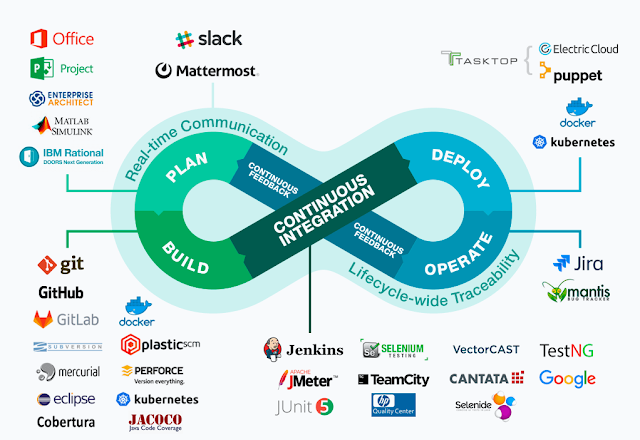
Nagios is used for continuous monitoring of systems, applications, services,s and business processes in a DevOps culture.
Why do we need Nagios?
Here are some of the important reasons to use the Nagios monitoring tool:
- Detects all types of network or server issues and sends alerts.
- Open Source, relatively scalable, Manageable, Secure, and more.
- Best Documentation available along with a Nice, informative, and attractive web interface.
- Good log & database system and it is very flexible.
- Helps us to find the root cause of the issue which allows us to get a permanent solution to the problem.
- Active complete monitoring of our entire infrastructure and business processes.
- Also helps you to monitor and troubleshoot server performance issues.
- Helps us to plan for infrastructure upgrades before outdated systems create failures.
- we can maintain the security and availability of the service
- Automatically fix problems in a panic situation
What can Nagios Monitor:
Nagios can do application monitoring, network monitoring, server monitoring, memory usage, disk usage, URL monitoring, HTTP status, content monitoring, hijack detection, microprocessor load, currently running processes, generating the log files,
it also monitors services, such as Simple
Mail Transfer Protocol (SMTP), Post Office Protocol 3 (POP3), Hypertext
Transfer Protocol (HTTP), and other common network protocols such as monitoring
routers, switches, and more.
Nagios Versions:
- Nagios core is fully open source
- Nagios XI enterprise edition, Free trial for 60 days.
Nagios Architecture:
- The process scheduler is a component of the Nagios server. It sends a signal to execute the plugins at the remote machine.
- The plugin gets the status from the remote machine.
- The plugin sends the data to the process scheduler as a response.
- The process scheduler updates the GUI and notifications are sent to admins if there is any issue.
How does it work?
- Mention all details in configuration files.
- Daemon read the details of what data is collected.
- Daemon uses NRPE plug-in to collect data from nodes and store it in its own database.
- Finally, store everything database and display it on a webpage.
Plugins
Plugins are the only extensions/agent to
Nagios Core that makes it possible to monitor anything and everything with
Core.
How does it work?
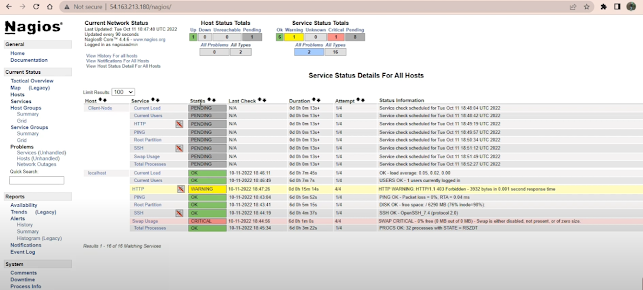
Nagios Dashboard (Web bases GUI of Nagios):
Below screenshot is having GUI of the Nagios
Dashboard, from the left panel you can check host details and Services details
which are monitored by Nagios Tool.
Nagios Dashboard Configuration?
Go to the host tab and you will get all the
host details which are attached to the Nagios tool for monitoring.
Go to the Services tab and you will get all the
services that are monitored under each host by the Nagios tool.
Configuring Client Node (NRPE Agent):
Installing the Nagios Plugins into the local
system or remote system for monitoring, it is also called client node
configuration.
NRPE Agent Configuration?
Alerting in Nagios:
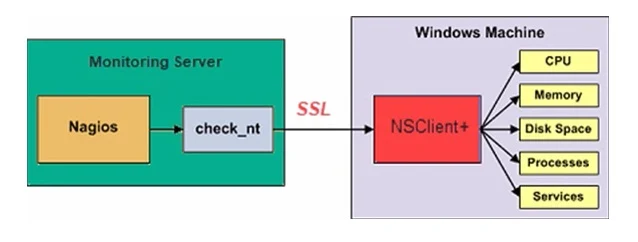
Configuring NSClient++ on Windows (check_nt plugin):
---
Thanks & Regards,
Kanchan Soni
(A girl who saw the dream with an open eye to compete with self-capability in the area of IT and its Next-Gen Technology, with the ability to complete the task with perfection.)
Email: kanchansoni.cse@gmail.com
BlogSpot: https://tapanpatni58.blogspot.com
Instagram: https://www.instagram.com/sonikanchan_
Facebook: https://www.facebook.com/soni.kanchan.soni/
Twitter: https://twitter.com/SoniKanchan_


Comments
Post a Comment