TOP MOST MONITORING TOOLS (OPEN SOURCE MONITORING TOOLS)
Hey folks,
On the topic of monitoring, we
have been discussing it for quite some time. I believe this is a good time to
move on to some overviews of tools and applications.
But before I get to the topic, I
would suggest reading my old blogs on monitoring so you can keep up with me on
the topic.
Link:
Now, we all know what monitoring is and its importance, so
in the market, there are numerous types of open-source monitoring tools are
available, and we will discuss some of these here:

1. Prometheus:
Prometheus is an open-source monitoring and alerting toolkit. It records real-time metrics in a time series database (allowing for high dimensionality) built using an HTTP pull model, with flexible queries and real-time alerting.
Uses a multi-dimensional data model with
time series data identified by metrics name and key/value pairs.

2. Grafana
Grafana is open-source visualization and
analytics software. it is not essential where your data is stored, Grafana can be
integrated from any source and queried, visualized, and explored. In plain
English, it helps us to cover time-series database (TSDB) matrix data into
beautiful graphs and visualizations.
Grafana dashboards are designed to bring
data together in an organized and efficient way. They enable users to better
comprehend their data using queries, information visualization, and alerts.
The tagline of Grafana: Dashboard anything. Observe everything
.jpeg)
Grafana
3. Nagios
Nagios is the best server monitoring
software in the market, it is open-source software for continuous monitoring of
systems, networks, and infrastructures (windows machines Linux machines,
network devices, switches farewell, routers, etc). Nagios runs on plugins
installed on your server which is connected with the host machine or any other
server of your network.

4. Thanos
Thanos is the extension of Prometheus or
scaling of Prometheus. it provides additional features over Prometheus like
global query view, high accessibility (HA), Long term storage, downsampling,
and affordable access to historical data in a single binary.

Thanos
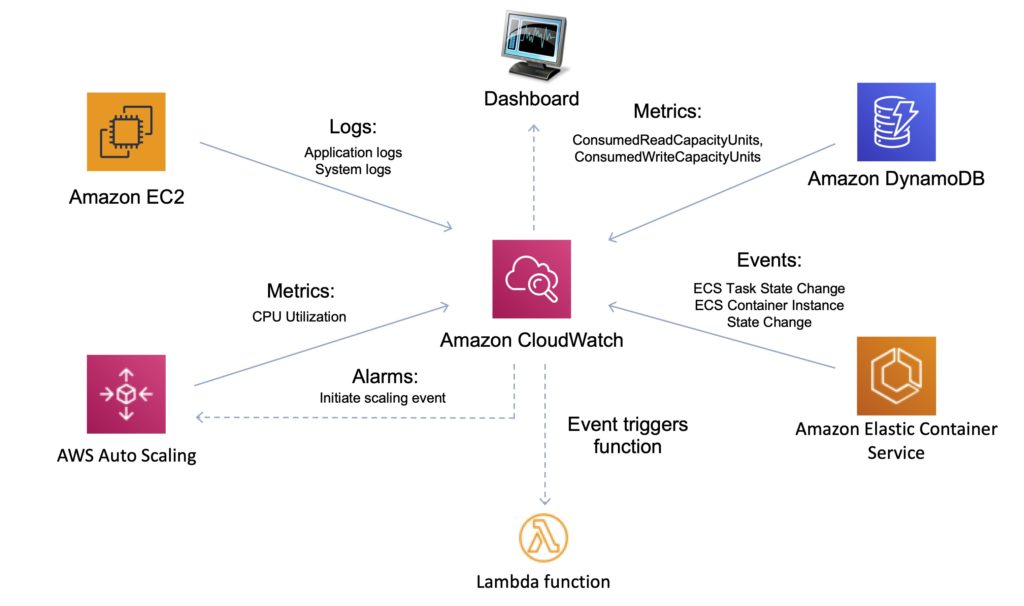
5. Cloud Watch
Amazon CloudWatch is a monitoring and
management service provided by AWS cloud providers. it enables us to monitor
applications, infrastructure, and services and use alarms, logs, and events
data to take automated actions. it also helps to reduce the mean time to
resolution (MTTR).
6. Data Dog
Datadog is a monitoring and analytics tool for DevOps teams it can be used to monitor performance metrics and event monitoring for infrastructure and cloud services. it can monitor services such as servers, databases, and tools. For metrics, companies used to buy a monitoring tool, and then for traces, they used to buy an APM tool, and then for logs a log management tool.
All these different things were disconnected
and didn't talk to each other but data dog is one of the popular tools which is
bringing all of it together and provides all types of monitoring in a single
tool.

Data Dog
7. Instana
Instana is a fully automated application
performance monitoring solution for cloud-native, multi-cloud, and hybrid cloud
applications. With a single agent of
Instana, we can fully automate application observability, delivering of
context needed to take intelligent actions and ensure optimum application
performance.

Instana
8. App Dynamics
Using AppDynamics' application
monitoring tool, you can prioritize what matters most to your business and your
team so you can see, share, and take action immediately. You can turn
application and user behavior into profit by improving performance.
AppDynamics provides a common view
across databases and server infrastructure delivering real-time, actionable
insights."

App Dynamics
Thanks & Regards,
Kanchan Soni
(A girl who saw the dream with an
open eye to compete with self-capability in the area of IT and its Next-Gen
Technology, with the ability to complete the task with perfection.)
Email: kanchansoni.cse@gmail.com
Linked in: www.linkedin.com/in/soni-kanchan
BlogSpot: https://tapanpatni58.blogspot.com
Instagram: https://www.instagram.com/sonikanchan_
Facebook: https://www.facebook.com/soni.kanchan.soni/
Twitter: https://twitter.com/SoniKanchan_


Nice article, keep on
ReplyDeleteVery informative blog.. But mere kam ka nhi h
ReplyDeleteGood Soniya
ReplyDeleteGreat information
ReplyDeleteVery informative...
ReplyDelete